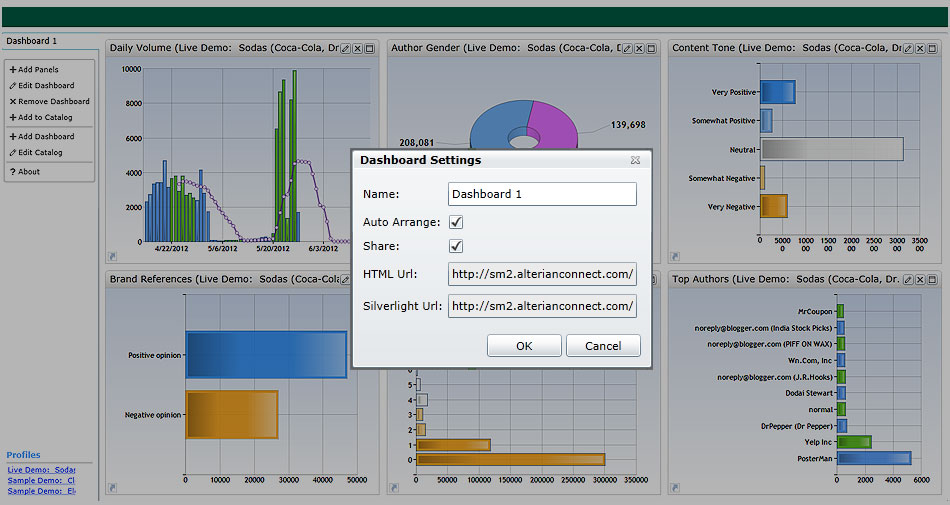
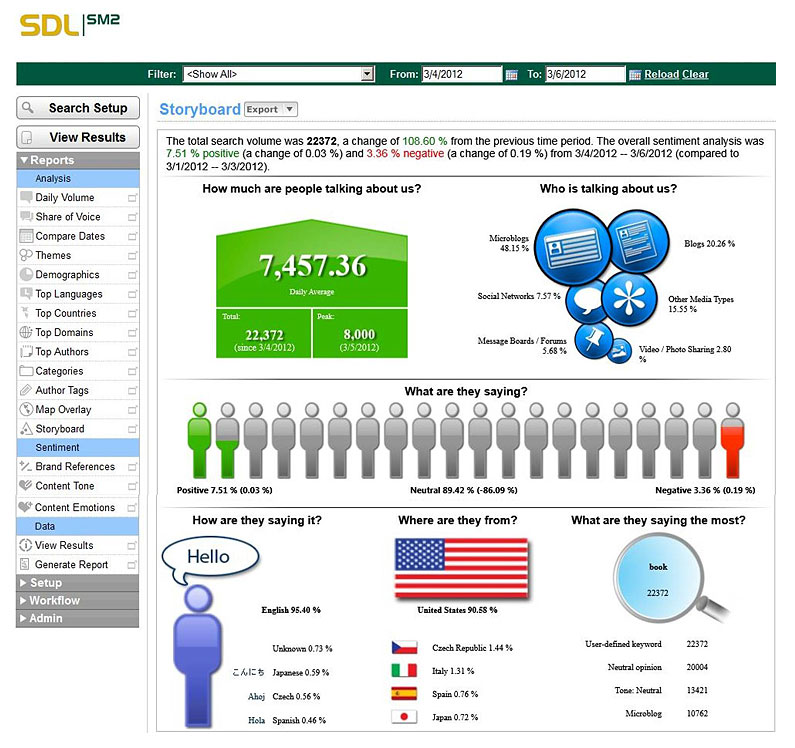
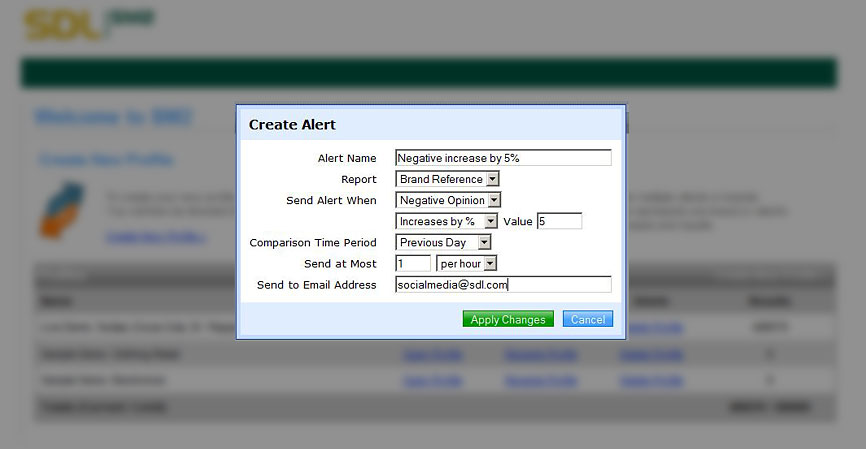
Sentiment Analysis reports make it easy to identify tone and emotion across a multitude of online conversations.
-
Spot changes over time.
-
Measure the success of a marketing campaign.
-
Benchmark your business against your competition.
-
Find out who is talking about your business – and what they’re saying.
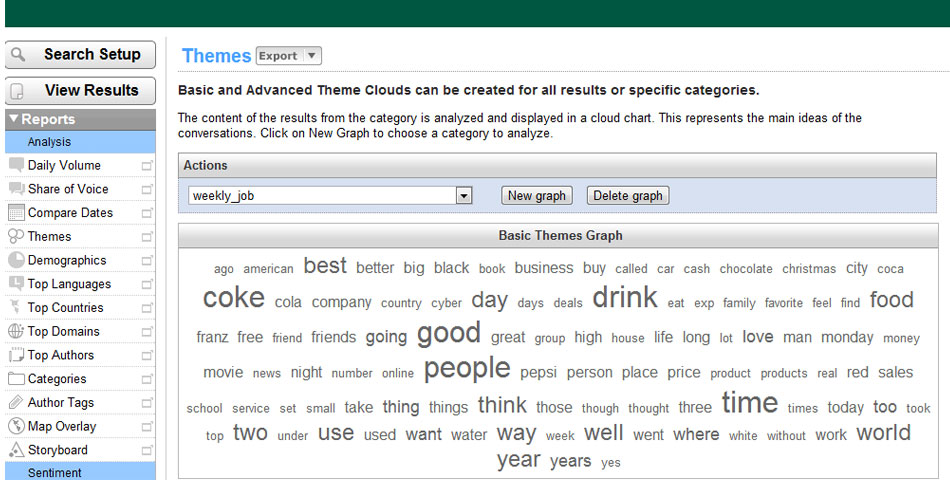
Themes and Word Cloud reports help you identify emerging topics that are important to your customers and prospects.
-
Find new areas to connect with your ideal customers.
-
Learn how your customers talk and think about your offerings.
-
Discover where a competitor is vulnerable.
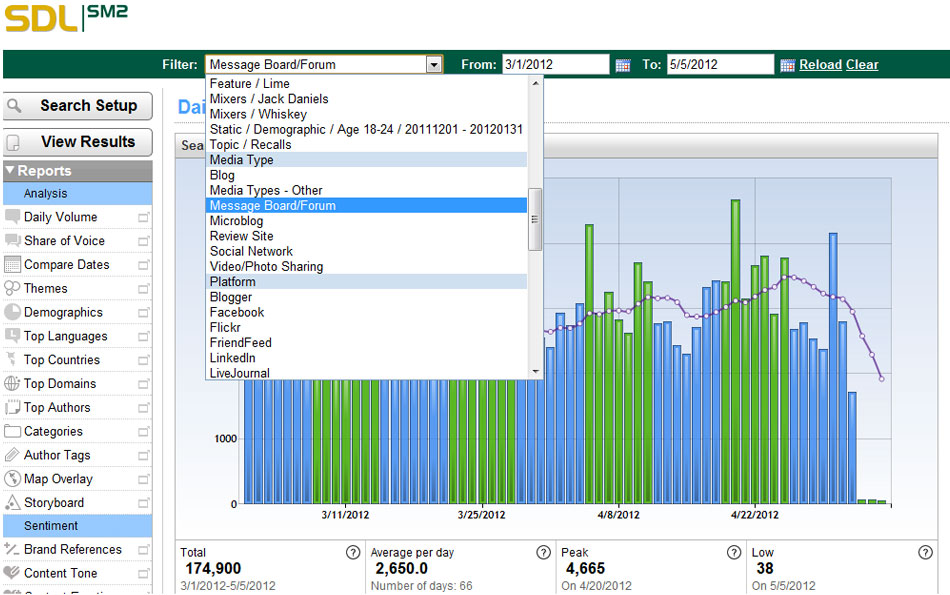
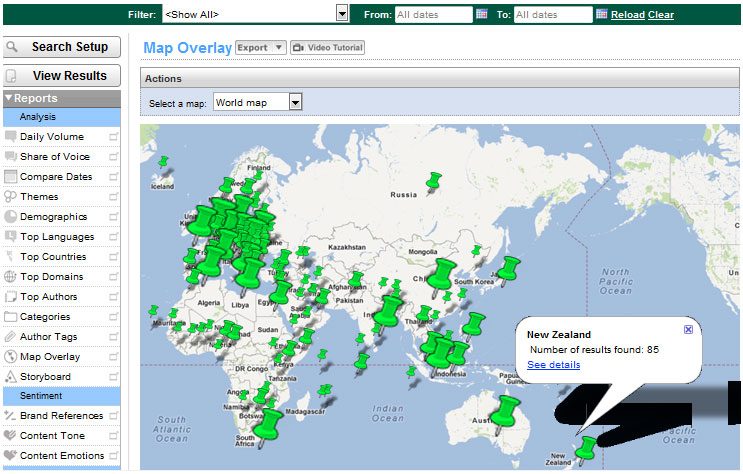
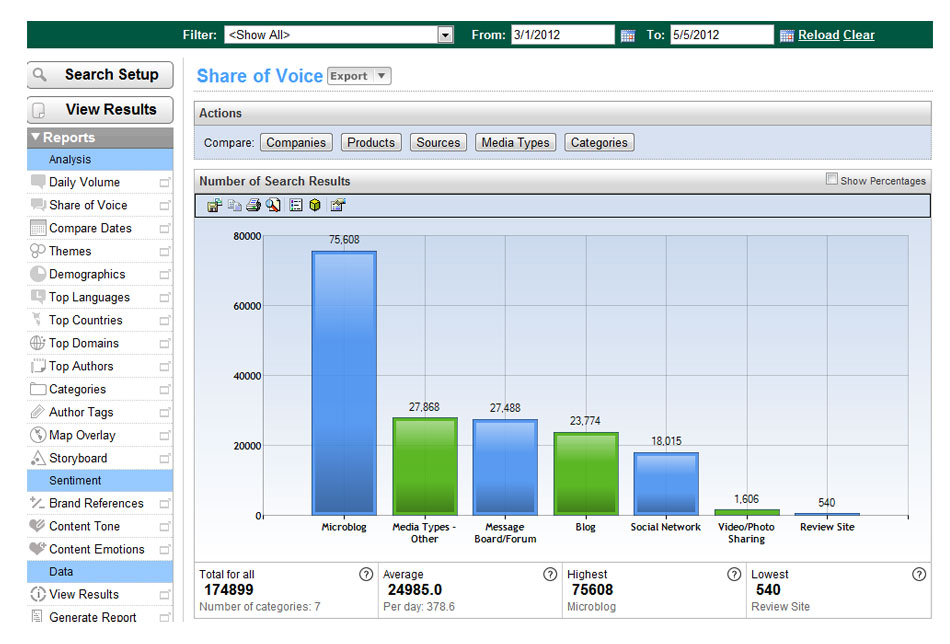
Share of Voice and Daily Volume reports tell you where and when people are talking about the things that matter to your business. Are your prospective customers talking on a message board you’ve never seen?
-
Save money by learning where to invest your marketing efforts – and which channels you can safely ignore.
-
A spike in volume alerts you when something is happening in the marketplace.
-
Click on any date or post to dig deeper.
Power and flexibility.
SM2 gives you access to a vast amount of data and reporting tools powerful enough to make sense of it all.

